Principle
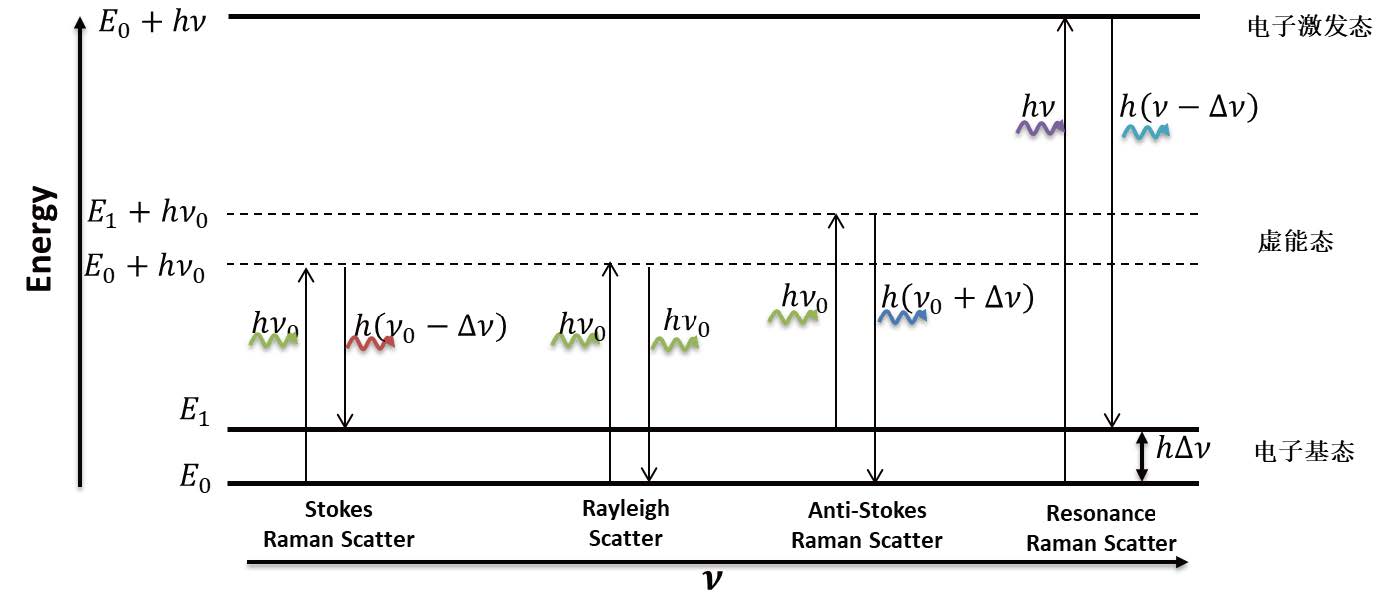
Raman Spectroscopy is a scattering technique which analyzes the scattered light of different wavelength than the incident light to obtain the molecule structure of the analyte. When a incident laser light illuminate the sample, light collide material molecules and scatter. Most of the scattered light features the same wavelength with the incident light, only a very small amount scattered light( typically 0.0000001% ) at different wavelengths with incident light, which is inelastic scatter called Raman scatter. The scattered light frequency less than incident light is called Stokes scattering, the scattered light frequency bigger than incident light is called Anti-Stokes scattering, they are symmetrically distributed on both sides of the Rayleigh scattering.
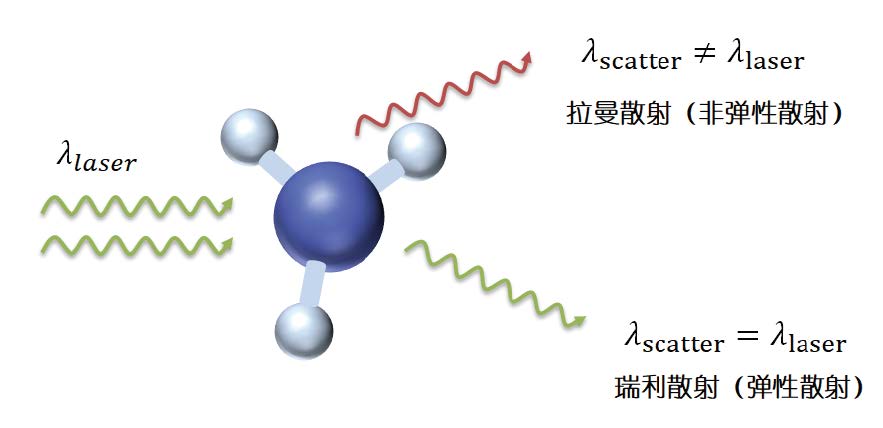
The frequency difference �v between the incident light and scattered light is called the Raman shift. Raman shift has no relationship with the incident light frequency, determined by the energy level structure of the material molecule, and different chemical bonds correspond one-to-one with the Raman shift, so the Raman spectrum is also considered to be the “fingerprint” of the material.
Advantage of the Raman spectrum
Molecule “Fingerprint”, identify the molecule structure and characteristic of the analyte
Non-destructive testing without sample marking
Simple sample preparation and measurement of samples containing water
Small amount of sample, detection spot less than 1 micron
High spatial resolution
High temperature and high pressure testing
Raman Spectroscopy Analytical Method
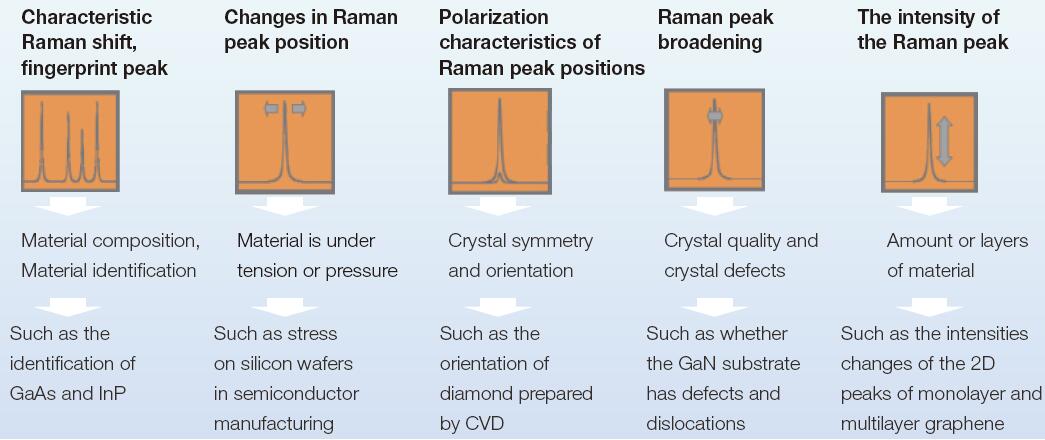
The intensity, frequency shift, line width, number of characteristic peak, and depolarization of Raman spectra are closely related to the vibrational energy state, rotational energy state, and symmetry of the molecule.
Product Overview
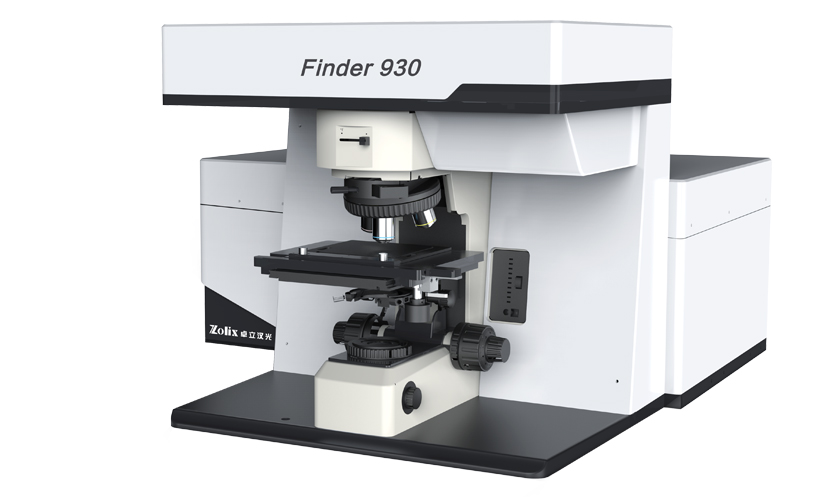
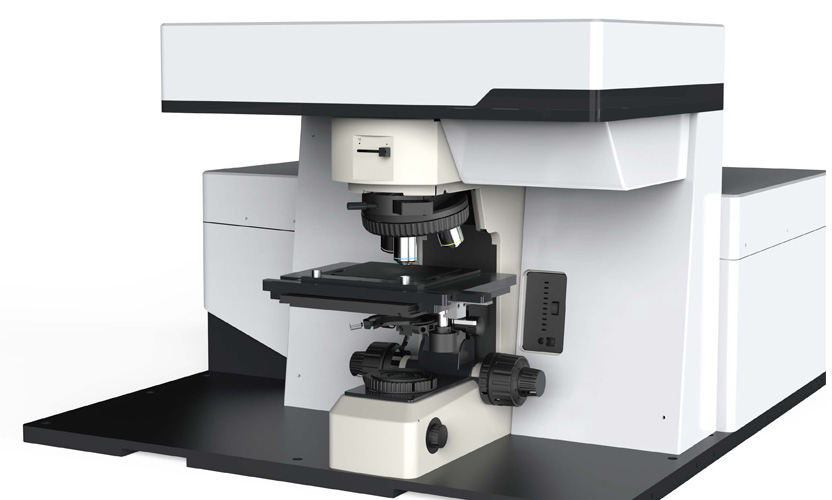
Since entering the field of Raman spectroscopy in 2003, Zolix has continued to accumulate technical strength, and continuously updated Raman products. The products have been widely used in materials, geology, biology, chemistry,medicine, food, investigate and other fields. After long-term discussions with customers in different industries, we have launched a new generation of Raman system: Finder 930, which aims to create a highend laser confocal Raman spectrometer with high performance, high stability and high cost performance. Based on the successful experience of previous generations of products, Finder 930 has been fully upgraded in hardware and software:
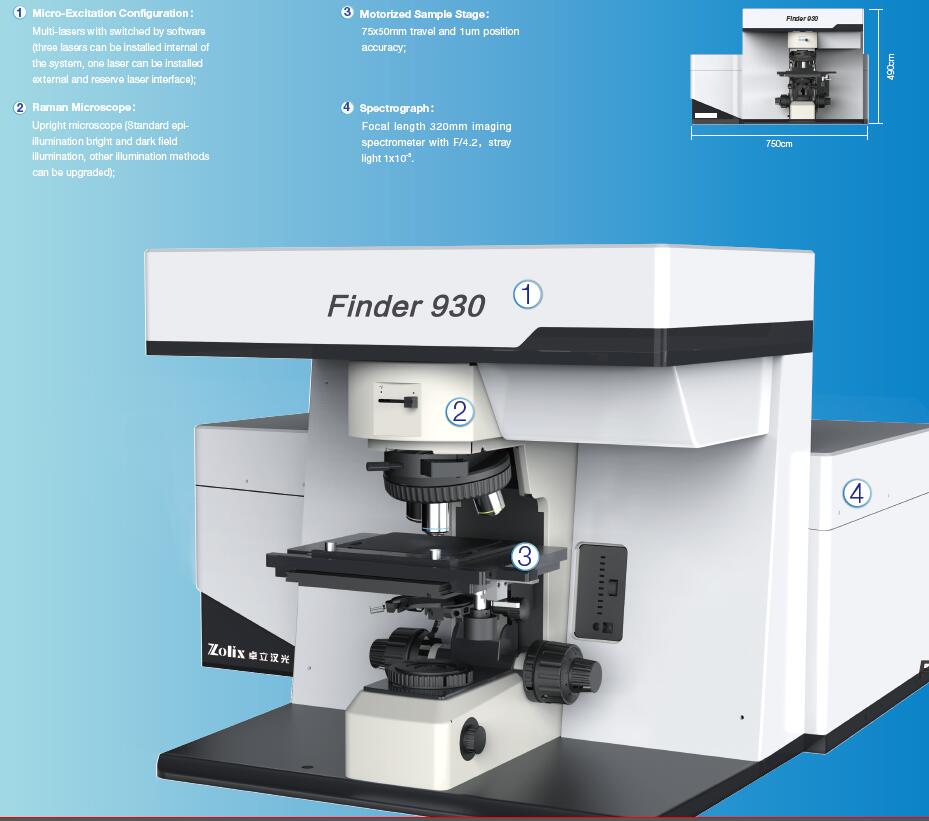
• Using a new generation of image calibration spectrometer, the imaging quality is better,and the wavelength repeatability and accuracy are higher, making your experiment data more reliable.
• The high-precision automatic electric control system intelligently controls laser switching,laser power, confocal pinhole size, and automatic optical path correction not only makes the equipment more intelligent and easier to operate, but also greatly improve the stability, plug and play, and maintenancefree.
• The new system software features fluorescence Mapping, Raman Mapping,fluorescence lifetime imaging, hyperspectral data processing, easy to use, making yourdata analysis more convenient and fast.
• The newly launched Finder 930 is a general analytical instrument with high performance, high reliability and high intelligence, and is a good helper for scientific research.
System Characteristic
System Characteristic
High Confocal Performance
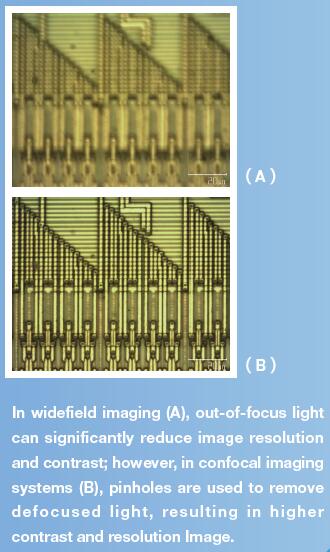
When a point light source (usually a laser) is focused on the sample through the objective lens, the image formed by this point is detected by the detector through the detection pinhole. At this time, the illumination pinhole and the detection pinhole are conjugate with respect to the focal plane of the objective lens. , which is confocal. In confocal microscopy, only the scattered light signal of the illuminated sample will be accepted, which ensures lateral spatial resolution; while the signal of the sample located in the illuminated area of the light source but not on the focal plane will be defocused due to defocusing. The probed pinhole (spatial filter) is strongly attenuated, which also ensures longitudinal spatial resolution. Therefore, when we move the sample up and down along the direction of incidence of the laser, we can focus the laser on different layers of the sample to achieve section analysis of the sample. Another advantage of confocals is that they have better background suppression for transparent, translucent samples, or samples with strong fluorescence and blackbody radiation backgrounds.
High system stability
The confocal Raman system has high requirements on the stability of the light spot, and the drift of the light spot will seriously affect the performance of the system. Therefore, ensuring the stability of the system is the primary issue.
1.The effect of temperature and humidity on stability
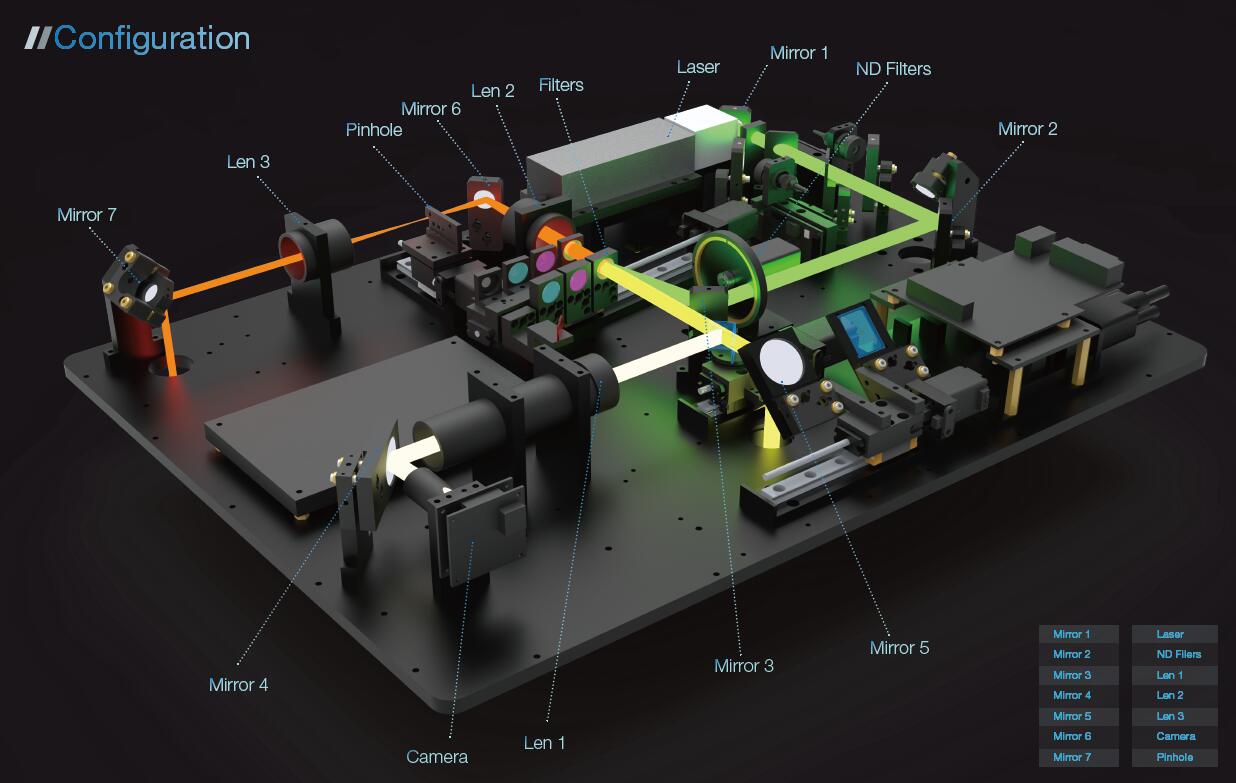
The temperature and humidity will deform the optical mount and cause the spot to drift, the longer the optical path,the greater the drift. In order to solve this problem, Finder 930 adopts the built-in laser, which minimizes the optical path, and at the same time uses the aviation aluminum optical mount that is minimally deformed by temperature and humidity.
2.The effect of optical path switching on stability
For a multi-channel laser system, there are high requirements for positioning accuracy and repeatability, normally a motorized stage is used to switch the laser light path. Finder 930 cleverly combines multiple lasers through dichroic mirrors without motorized stage. When replacing lasers, only the lasers need to be switched on and off, avoiding the effect of the motorized stage on the optical path of the system.
Excellent Spectrum Imaging Capabilities
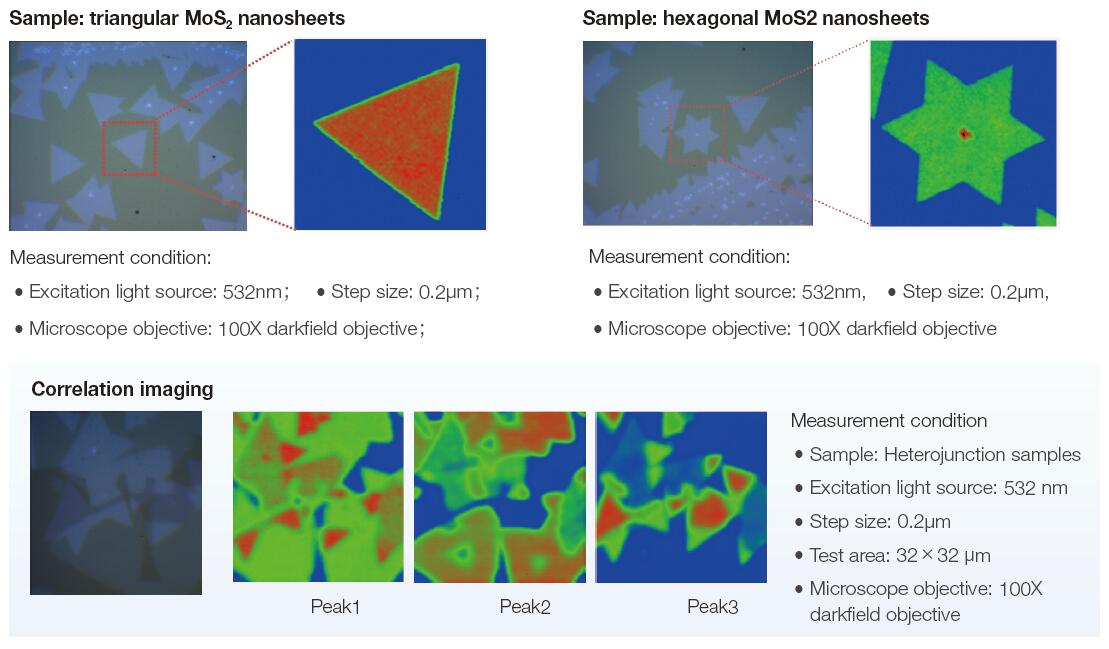
Raman Mapping can intuitively reflect the molecular properties of substances with high spatial resolution and fast imaging speed.
1.Spatial Resolution:
Lateral (XY)and Longitudinal(Z); Lateral resolution can be affected by objective NA, laser wavelength, pinhole size and laser beam quality;
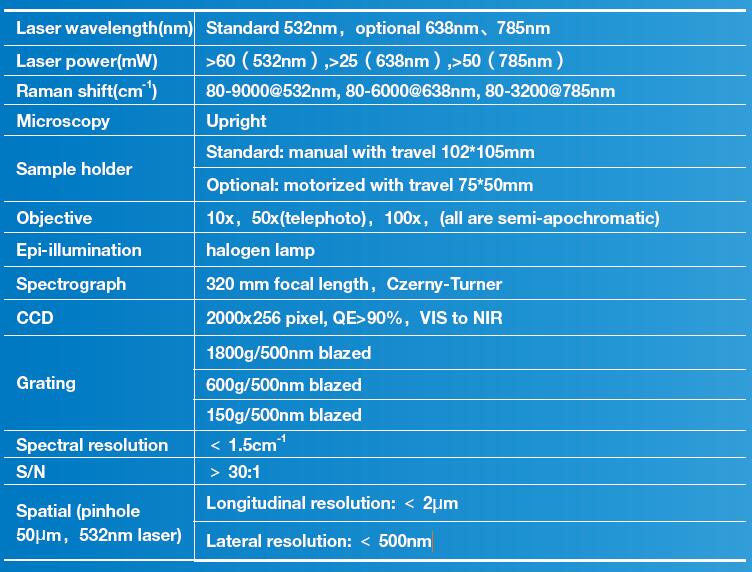
Longitudinal resolution is the confocal performance we are talking about. In addition to the above factors, it also has a great relationship with the optimal design of the system.This Raman System Finder930: Lateral resolution will be 0.5um and Longitudinal resolution 1.79um when 532nm laser with 100X, 0.9NA objective;
2.Mapping Imaging Speed
Mapping imaging speed is very important parameter which mainly depends on system sensitivity, motorized accuracy and software processing. The sensitivity will be higher enough, the acquisition time of single spectrum will be shorter, and the mapping speed can be improved; High precision motorized stage will prevent image distortion; The software mapping logic will improve mapping speed with the synchronization function and software real-time processing such as noise suppression and background subtraction can extract Raman spectra from weak signals and complex signals for real-time display.
Software Analysis
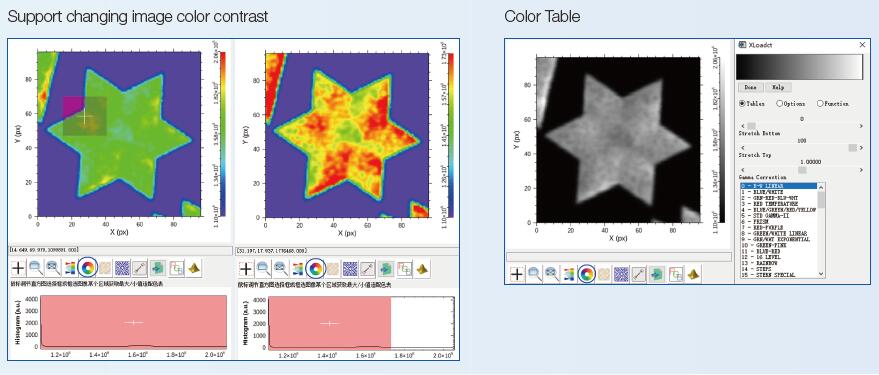
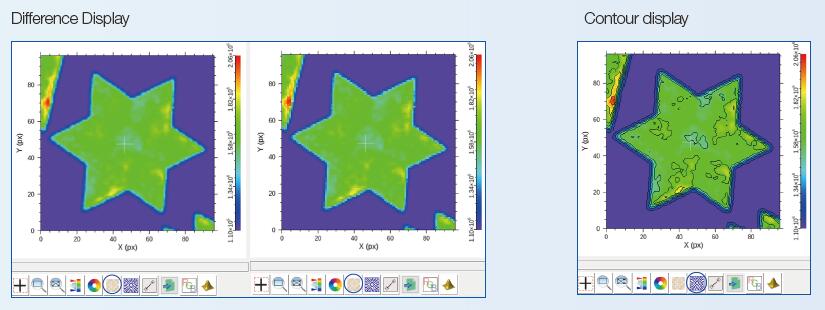
With powerful data analysis software, the Mapping data can be pre-processed such as de-baseline and smoothing, and then can be imaged through the integration, average, and maximum values of signal intensity according to requirements; in addition, single-peak and multi-peak Perform data fitting. For the output image, beautification processing such as color table matching can be performed.
Browsing Data
System Technical Information
 13910278534
 010-56370168